Colleges That Reach NCAA Men’s Basketball Final Four Often See Application Bump
Reaching the NCAA men’s Final Four can be a historic moment for a college basketball program — but it’s also an excellent way for the college or university to market itself.
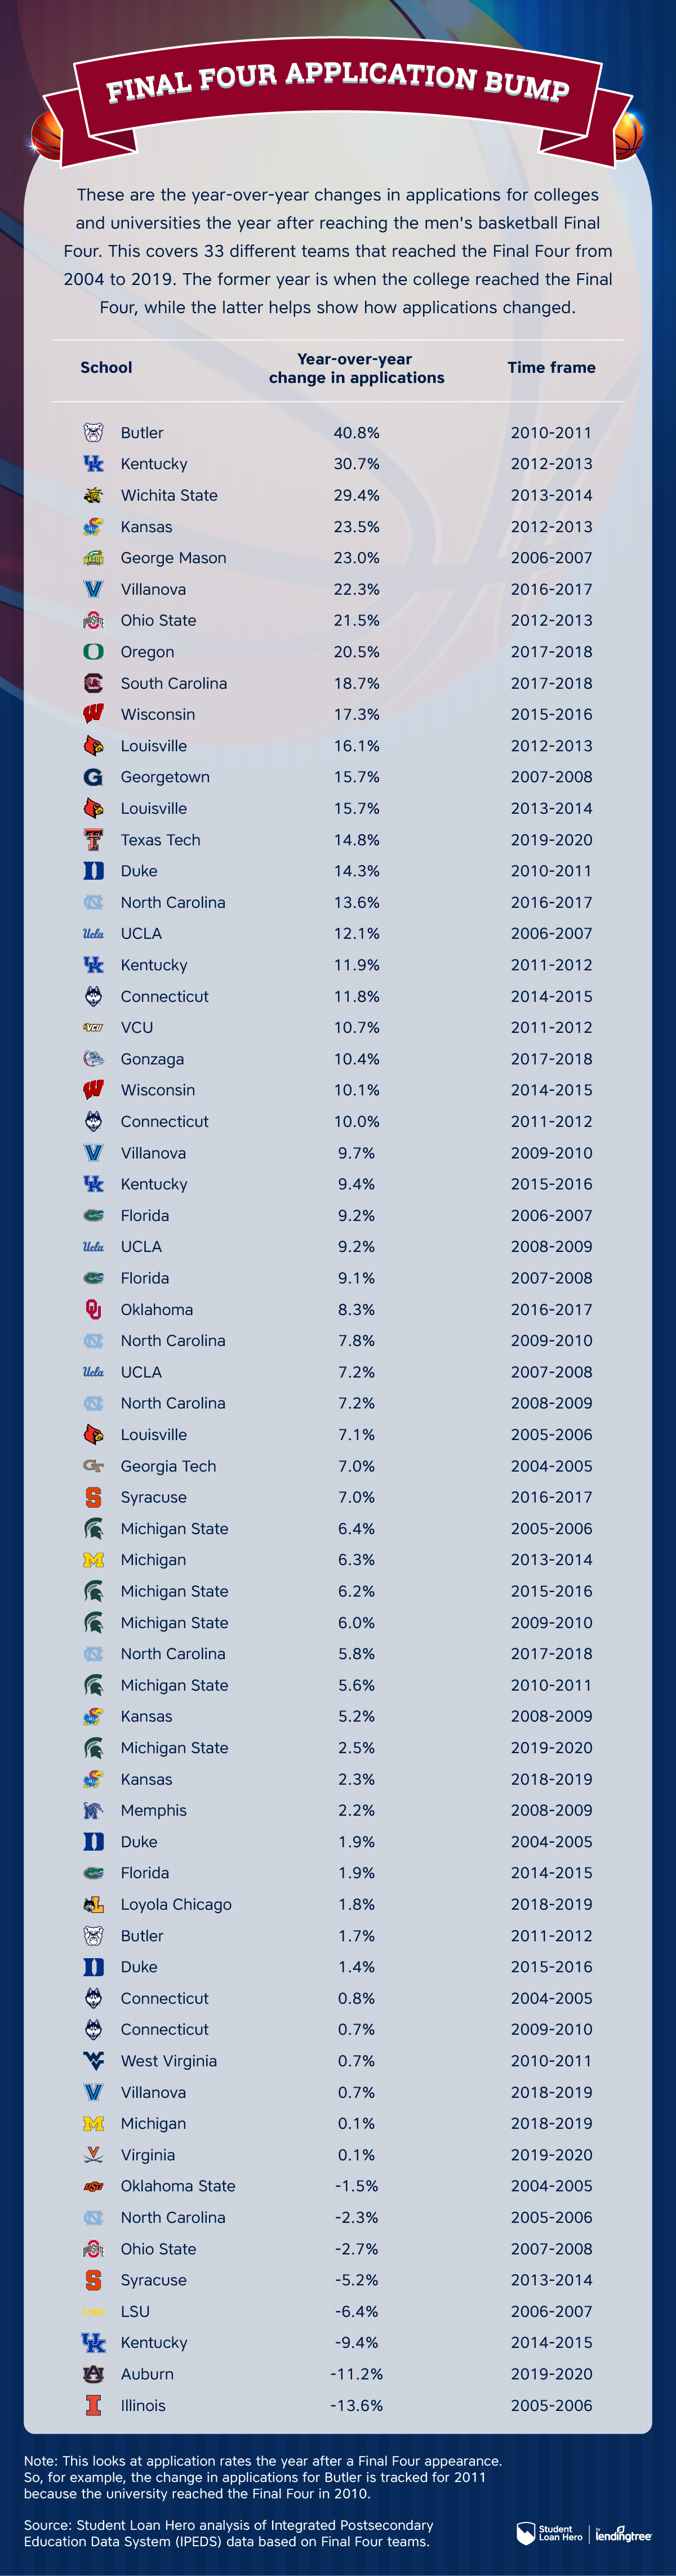
Schools like Butler, Kentucky, Wichita State and Kansas have seen significant spikes in applications the year after making it to the Final Four, even if they didn’t win the national championship. Other schools, however, weren’t so lucky, seeing a steep drop in application rates the following year.
Student Loan Hero researchers dug into the data dating to 2004 to see whether the extra air time and excitement around a college influences whether prospective students see it as a good place to take out student loans and pursue a higher education. By tracking applications the following year, we can look to see whether there’s a Final Four bump.
Key findings
- Colleges that reach the NCAA men’s basketball Final Four often see a combined increase in applications that outpaces the national rate. In 12 of 16 tournaments beginning with 2004, the four Final Four teams have combined for a year-over-year rise in applications the year after their appearances that’s higher than the national increase. From 2005 to 2020, Final Four schools have seen an average year-over-year rise of 8.1%, versus 4.6% nationally.
- Nearly every school that made the Final Four from 2004 to 2019 has seen an increase in applications the following year. Of the 64 teams in the Final Four over this period, just eight have seen decreases the year after their tourney appearance.
- Butler University saw the biggest increase in applications after reaching the Final Four. The Indianapolis school lost to Duke University by two points in the 2010 national championship game. A year later in 2011, applications spiked 40.8% year over year.
- Only two schools saw double-digit decreases in applications after reaching the Final Four. The University of Illinois reached the championship in 2005 — losing to the University of North Carolina. A year later in 2006, applications dropped 13.6% year over year. The only other school that saw a double-digit decrease was Auburn University in 2020 after reaching the Final Four the previous year.
College applications at schools that reach the men’s basketball Final Four often outpace the national rate
In many ways, college sports can serve as a great marketing tool for universities — especially if a team is featured nationally amid the March Madness hoopla.
As a result, many public and private colleges and universities prioritize their athletic departments, according to Student Loan Hero senior writer Andrew Pentis.
“The more time their school is highlighted on national TV, the more their brand is strengthened in the minds of students and families, particularly those who have an interest in sports or just being around the campus excitement,” Pentis says. “Let’s face it: Many Americans still think of the college experience as spending four years on a big campus brought together by major sporting events.”
This approach seems to favor colleges and universities with popular men’s basketball programs. Since the 2004 men’s tournament, schools that reach the Final Four have typically experienced a drastic year-over-year increase in college applications the following year.
Whether the teams win or lose once reaching the Final Four, the combined percentages among the four teams in any given year are often so high that they beat out application rates on a national scale. This has proved true for 12 of the 16 tournaments starting in 2004.
To reiterate: The data within this piece looks at college applications the year after a team reached the Final Four. For example, the University of Connecticut won the national championship in 2004, so researchers looked at college application figures in 2005. Acceptance letters usually start arriving in mid-March — during the tournament — so a college reaching the Final Four wouldn’t impact admissions that fall.
From 2005 to 2020, the average combined boost in college applications among the schools that reached the Final Four the previous year was 8.1%, nearly double the national rate of 4.6%.
| Year-over-year changes in applications (the year after reaching the Final Four) | ||
|---|---|---|
| Final Four YoY change | National YoY change | |
| 2005 | 2.1% | 0.2% |
| 2006 | -0.6% | 1.9% |
| 2007 | 9.5% | 6.0% |
| 2008 | 7.3% | 2.5% |
| 2009 | 6.0% | 5.0% |
| 2010 | 6.1% | 4.1% |
| 2011 | 15.4% | 4.9% |
| 2012 | 8.6% | 3.7% |
| 2013 | 23.0% | 3.3% |
| 2014 | 11.6% | 5.0% |
| 2015 | 3.6% | 4.9% |
| 2016 | 8.6% | 6.1% |
| 2017 | 12.8% | 7.1% |
| 2018 | 13.9% | 6.8% |
| 2019 | 1.2% | 6.2% |
| 2020 | 1.6% | 5.1% |
| Total | 8.1% | 4.6% |
|
Source: Student Loan Hero analysis of Integrated Postsecondary Education Data System (IPEDS) data based on Final Four teams. Note: This looks at application rates the year after a Final Four appearance. So, for example, the Final Four year-over-year (YoY) change for 2005 is the average YoY change that year across the four teams that reached the 2004 Final Four: Connecticut, Georgia Tech, Duke and Oklahoma State. The national YoY change accounts for every four-year college and university college with available data within that same year. |
||
In some years, schools that made it to the Final Four had college application rates that were leagues greater than the national average. Take 2013, for example, where the average across the four schools that made that stage of the tourney the previous year (Kentucky, Kansas, Ohio State and Louisville) was 23.0%. Meanwhile, the national average that year across all colleges with available data was just 3.3%.
Attending much-beloved basketball games is a great way for students to socialize, but it can also be a means for those studying to enter certain industries, like sports and entertainment, to get their foot in the door with internships on campus, says Pentis. This can apply to students who are aspiring journalists and media professionals or those studying business.
“More generally, though, the presence of an NCAA tourney-quality program adds to the prestige of the school, even if it has little to do with the quality of academics,” he adds.
College applications increase the following year for nearly every Final Four team
Since the 2004 tournament, in most instances when schools have reached the Final Four — 56 out of 64, to be exact — they’ve watched their university or college application numbers increase the next academic year, with the top surges as follows:
- 2011: Butler (40.8% — lost in the title game in 2010)
- 2013: Kentucky (30.7% — won a national title in 2012)
- 2014: Wichita State (29.4% — reached the Final Four in 2013)
- 2013: Kansas (23.5% — lost in the title game in 2012)
- 2007: George Mason (23.0% — reached the Final Four in 2006)
However, not all schools had success regarding college applications the following year. Among the teams that reached the Final Four from 2004 to 2019, eight schools experienced decreases in college applications the following year:
- 2006: Illinois (13.6% — lost in the title game in 2005)
- 2020: Auburn (11.2% — reached the Final Four in 2019)
- 2015: Kentucky (9.4% — lost in the title game in 2014)
- 2007: LSU (6.4% — reached the Final Four in 2006)
- 2014: Syracuse (5.2% — reached the Final Four in 2013)
- 2008: Ohio State (2.7% — lost in the title game in 2007)
- 2006: North Carolina (2.3% — won the national title in 2005)
- 2005: Oklahoma State (1.5% — reached the Final Four in 2004)
Notably, the data doesn’t appear to show an added application bonus for schools that win a national title over those that just make it to the Final Four. In a 2019 semifinal game, Auburn lost a heartbreaker to Virginia 63-62 after the Cavaliers’ Kyle Guy made three free throws with 0.6 seconds on the clock; applications fell 11.2% the following year. But other teams on this list, like North Carolina, came out on top as national champions.
Interestingly, both the 2005 national champion — North Carolina — and the runner-up — Illinois — experienced decreases in college applications the following year.
“Of course, the reasons for a decline in applications could also be entirely independent of basketball,” Pentis says. “Maybe some of them tightened their admission standards, for instance, or increased their sticker price.”
Butler saw the largest increase in college applications after losing the 2010 national championship to Duke
Despite narrowly losing to Duke in the 2010 national championship, Butler’s appearance in the Final Four paid off greatly for the school.
The following year in 2011, the number of Butler’s college applications shot up by 40.8%. That year, the school received 9,518 college applications, compared with 6,760 the year prior in 2010.
This was quite a large spike, even compared to other top-ranking schools that reached the Final Four in later years:
- 2013: Kentucky (30.7% — 19,810 applications, up from 15,153 in 2012 when it won the national title)
- 2014: Wichita State (29.4% — 4,517 applications, up from 3,492 in 2013 when it reached the Final Four)
- 2013: Kansas (23.5% — 12,389 applications, up from 10,035 in 2012 when it lost in the title game)
In 2011, Butler’s year-over-year jump in application rates was nearly triple Duke’s rate at 14.3% that same year. The 2010 national champion received 25,462 applications that year, up from 22,280 the previous year.
“2010 was a real statement year for Butler, that it was, in fact, a real ‘basketball school’ to be reckoned with,” Pentis notes.
Many students and families like the idea of attending a “basketball school,” Pentis explains, in part for the camaraderie that it adds to the campus environment.
“For Butler, coming close to beating big, bad Duke was enough to successfully market itself,” he says. “It didn’t have to win the game.”
College applications decreased in the double digits for just two Final Four schools: Illinois and Auburn
The opposite of Butler University’s experience, these schools witnessed double-digit drops in college application rates the year after reaching the Final Four:
- 2006: Illinois (-13.6%)
- 2020: Auburn (-11.2%)
The year prior in 2005, Illinois lost to North Carolina in the national championship game, 75-70. It was the school’s only Final Four appearance in the 2004-to-2019 timeline for this study — the school last made it this far in 1989.
In 2006, the school received just 18,985 applicants, as opposed to the year before, when it had gotten 21,986 applicants. This, however, seemed to line up with numbers at Illinois gradually dropping — the school had received 22,269 applications in 2004.
Another fact worth noting: In that same year, Illinois’ finals competitor — North Carolina — also experienced a decrease in application rates (2.3%).
The only other time that a school that reached the Final Four between 2004 and 2019 saw a drastic decrease in application rates was at Auburn — and recently. In 2019, the school lost in the semis on three final-second free throws by Virginia — which went on to become the national champion.
The school received only 17,946 college applications in 2020, a much different story from 2019 when it received 20,205. However, like Illinois, even these numbers dropped further from 2018, when 20,742 students applied.
And while it didn’t quite reach double digits, Kentucky came close in 2015 with a 9.4% decrease in application rates. In 2014, the school lost to UConn in the national title game, 60-54.
Despite having made it to the Final Four three other times (2011, 2012, and 2015), it was the only instance in the school’s history where the team made it into the tournament and experienced a decrease in applicants the following year.
Student Loan Hero researchers first compiled the list of colleges that reached the NCAA men’s basketball Final Four every year from 2004 to 2019. Researchers then pulled the number of applications to schools that reached the Final Four every year in that period. (The 2020 tournament was canceled amid the coronavirus pandemic.)
Analysts then calculated the percentage change in the number of applications the year after the team reached the Final Four. (For example, the University of Connecticut won the national championship in 2004, so analysts looked at the year-over-year change in applications the following year in 2005.)
Researchers also ranked the 64 teams that made the Final Four in the 2004-to-2019 period to see where each school ranked in this period. To make comparisons, researchers analyzed the number of applications at all U.S. colleges with available data. Application data comes from the Integrated Postsecondary Education Data System (IPEDS).
Comments are closed.